Create Dynamic Formulas in Microsoft Excel
You can take advantage of Microsoft Excel's dynamic formulas – formulas that produce data on the fly – in Blueprint document templates. AutoTag carries functions across cells, and it knows when to include new cells and when to change range numbers. Here we will walk though two simple examples while keeping in mind that AutoTag has much more sophisticated dynamic formula capabilities.
This tutorial begins with a blank template connected to the Northwind XML data source. For more information on how to connect to a data source, see About Data Sources.
The examples in this tutorial use the sample data source Northwind. You can perform the same steps on your own by using the Northwind XML file that ships with AutoTag. Or, you can follow these steps with your Blueprint project xml data, keeping in mind that your specific choices (data source location, and so on) will be different from what's listed here.
Tutorial
Step 1 - Create a Table
Before you can begin placing tags in the template, you need to know where they will go. In this example, you will be creating a table of products and information about those products.
This table will have columns for the invoice number, the product ID, the product's unit price, the product's quantity, and a column subtotalling the cost of each product ordered.
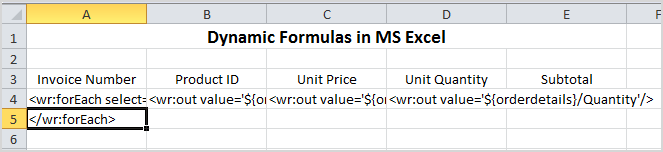
Choose ten cells in Excel in which you will create a 5 by 2 table. This size is chosen because it provides one column for each data category. In the first row, place the data titles, and in the second row, place the tags.
You do not need to know how many rows of data will be output when you run the report; AutoTag takes care of expanding that for you automatically.
We recommend you not use the table command in Excel. Instead, use cells only for table construction.
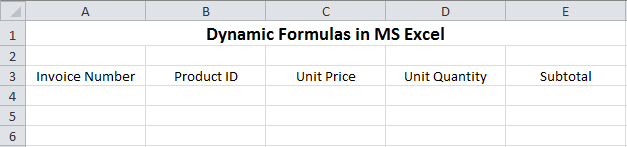
In the table's first row, enter the column headings:
Step 2 - Create a <forEach> Tag
- Click the first cell in what will be the second row of the table (the cell A4 in the image above).
- Click the Tag Builder button.
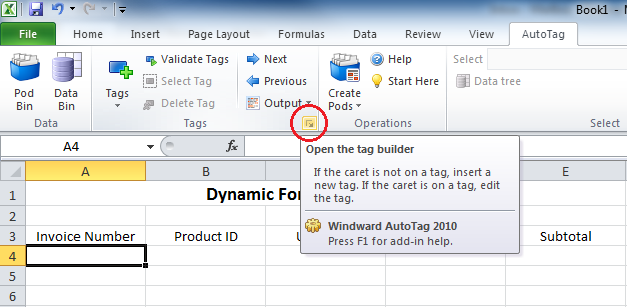
- In the Tag Editor, click the Tags tab, and click the <ForEach> Tag icon.
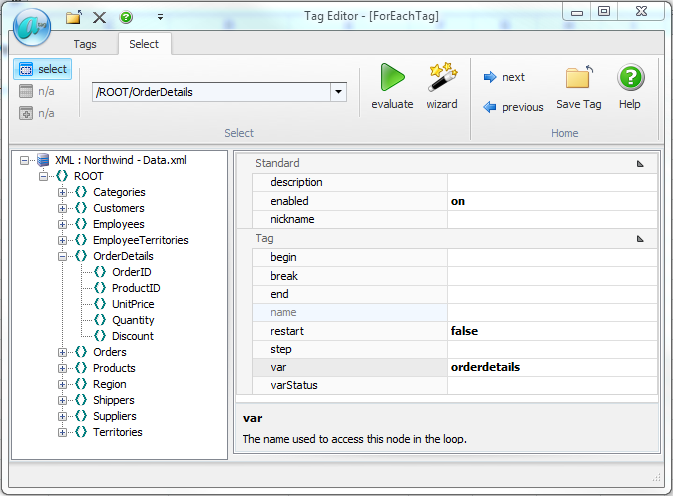
- Click the Select tab. Since you will be creating a table of data from subgroups of the Order Details data group, that's the group you want to loop through. Click the Order Details data group in the Data Source pane, and drag and drop that group into the Select Bar.
- Give the variable a descriptive name, such as "orderdetails." The tag editor now looks like this:
- Save the tag.
Step 3 - Create the First <out> Tag
Now it's time to place data subgroups into the individual cells.
Click the cell that holds the <forEach> tag, and click the Tag Builder button. A prompt appears, asking you where you'd like to place the tag:

Place your cursor just after the colon (:) and click.
The Tag Builder window opens. Follow the same general procedure as you did with the <ForEach> tag, with a few changes:
- Click the Tags tab and click the <Out> Tag icon.
The <out> tag is the default tag type, so this is already done for you
- Click the Select tab.
- In the Data Source pane, click the + sign next to the <forEach> tag name that you created – in this case, orderdetails – to expand it.
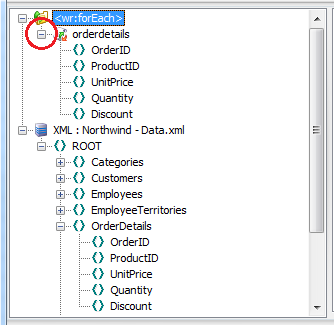
- The OrderID group contains the invoice number, so drag the OrderID data subgroup from the orderdetails variable into the Select Bar.
Be sure to drag and drop the correct OrderID data subgroup, as there are two listed in the Data Source Pane.
Drag and drop the data subgroup from the orderdetails variable, not from the main data source listed below it.
- Save the tag.
Step 4 - Create Additional <out> Tags
Using the same procedures that you followed in step three, create <out> tags for the three remaining cells.
The ProductID subgroup goes in the select bar for the tag in the Product ID column, the UnitPrice subgroup goes in the select bar of the tag in the Unit Price column, and the Quantity subgroup goes in the select bar of the tag in the Unit Quantity column.
Of course, each of these <out> tags will be in its own cell, so you will not see a prompt asking you where to insert the tag.
Step 5 - Close the <forEach> Loop
Next is to place data subgroups into the individual cells.
Click the cell that holds the <forEach> tag, and click the Tag Builder button. A prompt appears, asking you where you'd like to place the tag:
If you're working with an SQL data source, the tag language you see above will vary slightly.
Step 6 - Create a Dynamic Formula for Multiplication
In the first example, we want to know how much is being spent on each item. In other words, we want to multiply the unit price by the unit quantity for each item, and that will give us our subtotal.
Click the cell below the cell labeled "subtotal."
Enter the formula Excel uses for multiplication, which is an equals sign, the location of the first cell to be multiplied, an asterisk, and the location of the second cell to be multiplied. Your template should resemble the following:
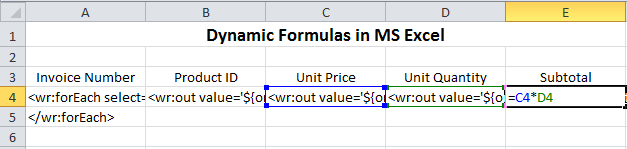
The power in using this formula is that AutoTag automatically expands the Subtotal cells to match the data. Instead of one subtotal, you will see a subtotal for each row. The database contains hundreds of orders, but you only have to input the formula once.
When AutoTag changes references in an Excel formula, it does not parse the formula to determine what parts are references. It just looks for XX123, where the letters are A – IV and then numbers.So if you have macro A2, as in “A2(B1, C3)”, AutoTag will think the A2 is a reference.
It's unlikely you will name a macro with 1 or 2 letters followed by a number. But if you do, AutoTag breaks because it will change the macro if it’s moved/replicated in the final report.
Step 7 (Optional) - Filter the Table
It is not necessary to add filters to our table in order to demonstrate formula features in Excel, but because you are working with a large set of data, you will do so now for two reasons: Your data source is quite large, and this will make illustrating the next formula much simpler.
Plus, the formula you are going to create will sum items, and using a filter now will allow you to demonstrate a very practical application: summing items and coming up with a total cost for a particular invoice in your system.
To begin:
- Click the cell containing the <forEach> tag and click the Tag Editor button.
- In the prompt, click the <forEach> tag.
- In the Tag Editor, click the Wizard icon.
XML Data Source
- In the Conditions Pane (the left pane), click the statement [click here to add a group]
- Click the statement [click here to enter a condition]
- Click the statement [click here to select a node], and select the subnode (subgroup) OrderID. (Remember, OrderID is the invoice number.)
- By default, the comparison is set to equal to, so you do not need to select a comparison.
- Take a look at the various OrderID values listed in the Data Pane on the right. There's one for invoice number 10248, and that's the one we'll use in our example. Click the statement [click here to set the value] and in the text box, enter the number 10248.
- You can see the entire select statement (the query that will be sent to the data source when you run the report) in the lower pane of the wizard. Click OK. This closes the XPath Wizard.
- Click the Save Tag icon. Your <forEach> tag (as seen in the formula bar) now looks like this:

SQL Database
- Drag the desired node (in this case, Order Details) from the left pane into the Columns area of the middle pane.
- In the Filter area of the middle pane, click the statement [click here to add a group]
- Click the statement [click here to add a filter]
- Click the statement [click here to select a node], and select the subnode OrderID from the pop-up window. (Remember, OrderID is the invoice number.)
- By default, the comparison is set to equal to, so you do not need to select a comparison.
- Take a look at the various OrderID values listed in the Data Pane on the right. There's one for invoice number 10248, and that's the one we'll use in our example. Click the statement [click here to set the value] and in the text box, enter the number 10248.
- You can see the entire select statement (the query that will be sent to the data source when you run the report) in the lower pane of the wizard. Click OK to close the wizard.
- Click the Save Tag icon. The end of your <forEach> tag (as seen in the formula bar) now looks like this:

Step 8 - Create a Dynamic Formula Using Excel's Autosum Feature
Now it's time to place data subgroups into the individual cells. Click the cell that holds the <forEach> tag, and click the Tag Builder button. A prompt appears, asking you where you'd like to place the tag:
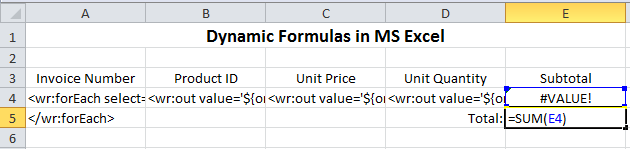
From Excel's Home tab, click the AutoSum icon. In the formula =SUM() put the location of the subtotal value, which in our example is E4, between the parentheses. Your template now looks like this:
Step 9 - Format the Table
Use familiar Excel commands, such as those in Excel's Home menu, to clean up the table. Because columns C and E are currency, format the columns accordingly. Also, change the font, add colors, reposition text, place borders around cells, and otherwise enhance the look of the table.
Save your document template using Excel's Save command. Then, from the AutoTag Run Report group, click the desired report format icon. In this example, we chose to view the report as a PDF file, and this is the result:
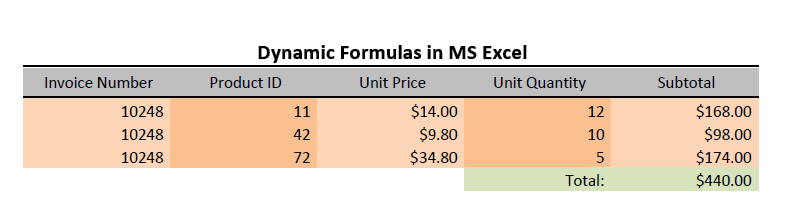
You may need to tweak your table dimensions a bit, as Excel does not let you auto-expand a cell as needed.